We’ve noticed a growing demand for infographics from our customers. What are infographics and how can they help you draw traffic to your site?
Definition
Information graphics or infographics are graphic visual representations of information,data or knowledge. These graphics present complex information quickly and clearly, such as in signs, maps, journalism, technical writing, and education. With an information graphic,computer scientists, mathematicians, and statisticians develop and communicate concepts using a single symbol to process information.
Overview
Today information graphics surround us in the media, in published works both pedestrian and scientific, in road signs and manuals. They illustrate information that would be unwieldy in text form, and act as a visual shorthand for everyday concepts such as stop and go.

In newspapers, infographics are commonly used to show the weather, as well as maps and site plans for newsworthy events, and graphs for statistical data. Some books are almost entirely made up of information graphics, such as David Macaulay’s The Way Things Work. Although they are used heavily in children’s books, they are also common in scientific literature, where they illustrate physical systems, especially ones that cannot be photographed (such as cutaway diagrams, astronomical diagrams, and images of microscopic or sub-microscopic systems).
Modern maps, especially route maps for transit systems, use infographic techniques to integrate a variety of information, such as the conceptual layout of the transit network, transfer points, and local landmarks.
Traffic signs and other public signs rely heavily on information graphics, such as stylized human figures (the ubiquitous stick figure), icons and emblems to represent concepts such as yield, caution, and the direction of traffic. Public places such as transit terminals usually have some sort of integrated “signage system” with standardized icons and stylized maps.
Technical manuals make extensive use of diagrams and also common icons to highlight warnings, dangers, and standards certifications.
Why are infographics becoming so popular?
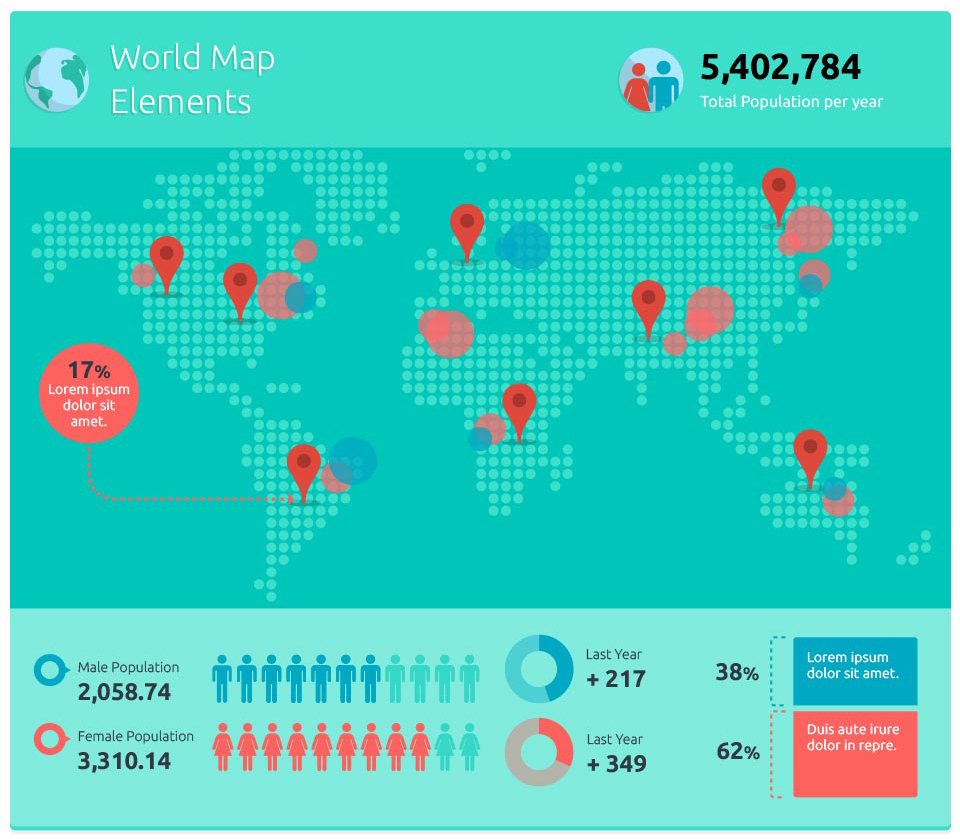
- Infographics can be fun and interactive – providing a light-hearted break for social media users, here’s just one of many image visualizations from the hugely popular site The Oatmeal.
- They can communicate an incredibly large set of data – displaying information in an interesting and meaningful way that instantly engages visitors. A recent example is this infographic to show the best value area to commute into London from.
- They’re different – every day we see page after page of black text on white backgrounds, which makes it difficult for us to remember every page we read, presenting information in an infographic on the other hand makes it easier to remember that information. How else could you explain the secrets of the mega shark?
So how do you decide when to use an infographic instead of standard text copy?
I would recommend using infographics and data visualizations when trying to explain an interesting idea which uses comparisons or takes into account a lot of relatively dull or uninteresting data.
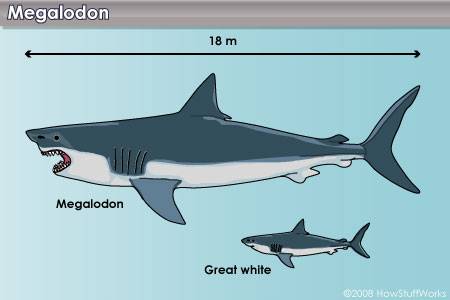
For example, I don’t imagine the Mega Shark blog post being anywhere near as popular if it were a text article outlining all of the physics calculations!
Using data visualization for SEO
So besides having an increasingly stronger response on social media websites how can you use infographics to your advantage? It’s common knowledge that images in general have a lower SEO impact than text copy, but there are a few ways that you can use them to benefit your site’s search engine optimization, and this mostly comes down to the link bait potential that info graphics have – we are even beginning to see infographic posts such as this excellent cool social media infographics post, and this top ten infographics post.
As an overview, the top tips to ensure maximum SEO benefit from your infographics should include:
- Host the infographic on your domain, making sure you get the link credit.
- Promote the infographic using social media bookmarking and networking sites such as StumbleUpon and Twitter.
- Submit your infographic to data visualization directories, to generate attention from designers and additional links.
- Name the infographic file with relevant, hyphen-separated keywords, to try and influence anchor text for any links generated.
- Host the infographic on image directories such as Flickr with a creative commons license that requires anyone who uses your image to include a link to your website.